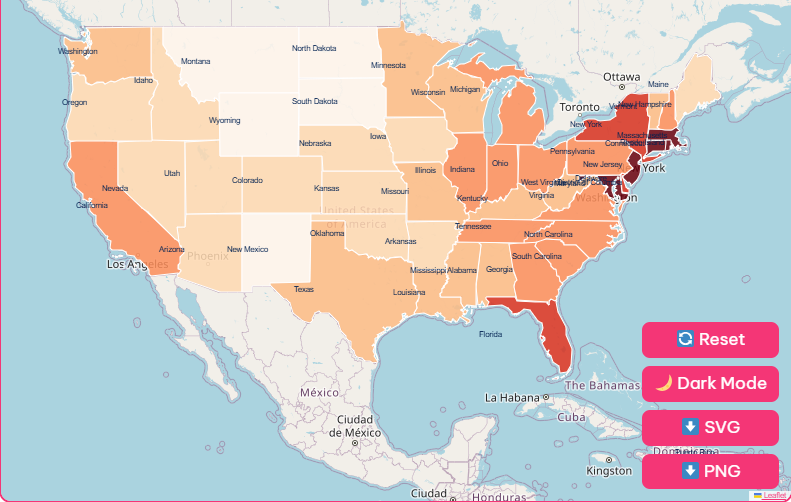
Tip: Click any state to explore, zoom in for detailed data, and download the map in printable SVG or PNG.

Have you ever wondered where most people in the United States live?
Population density maps provide a powerful visual answer, revealing the intricate patterns of human settlement across the country.
These maps are more than just colorful representations of data; they are essential tools for urban planners, businesses, and researchers alike.
Understanding Population Density
Population density is a straightforward but powerful metric. It measures the number of people living within a specific land area, typically expressed as people per square mile.
Calculation: Population Density = Total Population / Land Area (in square miles)
The average population density for the entire United States is about 94 people per square mile.
However, this number doesn’t tell the whole story. Density varies dramatically from bustling cities to vast, open landscapes.
A US population density map allows us to see these variations at different levels, including:
- State: Comparing population concentration between states like New Jersey and Montana.
- County: Zooming in to see how the population is distributed within a state.
- Census Tract: Offering a granular view of neighborhoods and smaller communities.
Sources for Population Density Maps
Several reliable sources provide the data needed to create detailed population density maps.
The most prominent is the U.S. Census Bureau, which conducts a national census every ten years.
U.S. Census Bureau
Their interactive demographic map viewer uses the latest 2020 Census data to display population density and other key metrics like age, race, and housing types.
It allows users to explore data at the state, county, and census tract levels.
North American Environmental Atlas
This resource offers a 2020 population density map derived from the Gridded Population of the
World (GPWv4) dataset, produced by the Center for International Earth Science Information Network (CIESIN) at Columbia University.
A Look at Population Density by Region
A US population density map with states reveals stark contrasts across the nation.
Certain regions, particularly on the coasts, are packed with people, while large swaths of the country remain sparsely populated.
High-Density States
The Northeast corridor is a prime example of high population density. States here are geographically smaller but contain major metropolitan areas.
| State | Population per sq. mile (2023) |
| New Jersey | 1,263 |
| Rhode Island | 1,060 |
| Massachusetts | 898 |
The District of Columbia, while not a state, has the highest density in the nation, with over 11,000 people per square mile.
Low-Density States
In contrast, many states in the West and Midwest have vast land areas with very few residents per square mile.
| State | Population per sq. mile (2023) |
| Alaska | 1 |
| Wyoming | 6 |
| Montana | 8 |
As noted by Wikipedia, you can see these sparse populations in the large east-to-west stretch from Seattle to Minneapolis or the area from northern Montana down to New Mexico.
Factors Influencing Population Density
Why do some areas attract millions of people while others remain nearly empty?
Population distribution is shaped by a complex interplay of factors that have evolved over centuries.
Historical Settlement Patterns
Early colonial settlements were concentrated along the East Coast, near ports and waterways that facilitated trade and transportation.
As the country expanded westward, new hubs emerged along rivers and railway lines.
Economic Opportunities
People move where the jobs are. The growth of industries like technology in Silicon Valley, finance in New York City,
and entertainment in Los Angeles has created dense population centers.
Geographic and Environmental Factors
Climate, terrain, and natural resources play a significant role.
Coastal areas and regions with temperate climates tend to be more populated than deserts, mountain ranges, or extremely cold regions.
For example, Chicago’s population is still heavily concentrated along the shoreline of Lake Michigan.
Urbanization and Migration Trends
The ongoing trend of people moving from rural to urban areas continues to increase density in and around major cities.
Zoning laws, as seen in San Francisco, can also directly influence how and where populations concentrate within a city.
Why Population Density Matters
Understanding population density is critical because it has far-reaching implications for nearly every aspect of society.
Resource Management and Infrastructure
High-density areas require extensive infrastructure, including transportation networks, housing, utilities, and public services like schools and hospitals.
A population density map helps planners allocate resources efficiently to meet demand.
Social and Economic Development
Businesses use density data to identify new markets. For instance, a retailer might look for densely populated neighborhoods to open a new store.
The data also informs economic policies and community development initiatives.
Environmental Consequences
Concentrated populations place significant strain on the environment, leading to increased pollution, waste generation, and habitat loss.
By analyzing density, environmental scientists and policymakers can develop strategies to promote sustainable urban growth.
Exploring with Our Interactive Map
Our US population density map is more than just a static image. It’s an interactive tool designed for in-depth exploration and analysis.
Here are some of its key features:
Interactive Exploration
Seamlessly zoom from a national overview down to state, county, and even census tract levels.
Color-Coded Visualization
Easily identify high and low-density areas with an intuitive color scheme.
Demographic Overlays
Add layers of other demographic data, such as age and race, for a richer analysis.
Multiple Download Formats
The map is available in SVG and PNG formats for easy integration into reports and presentations.
You can also download the raw datasets for your own analysis.
Your Guide to US Population Patterns
By visualizing where people live, we can better plan for the future and build smarter, more sustainable communities.
Ready to uncover the demographic trends shaping the nation?
[Download your free map today].
Frequently Asked Questions
How frequently is the population density data updated on the map?
The population density data is updated every 10 years, aligned with the U.S. Census Bureau’s decennial census.
Can I use the map for commercial purposes?
Yes, the map is available for both personal and commercial use, making it a valuable resource for market research, site selection, and other business applications.