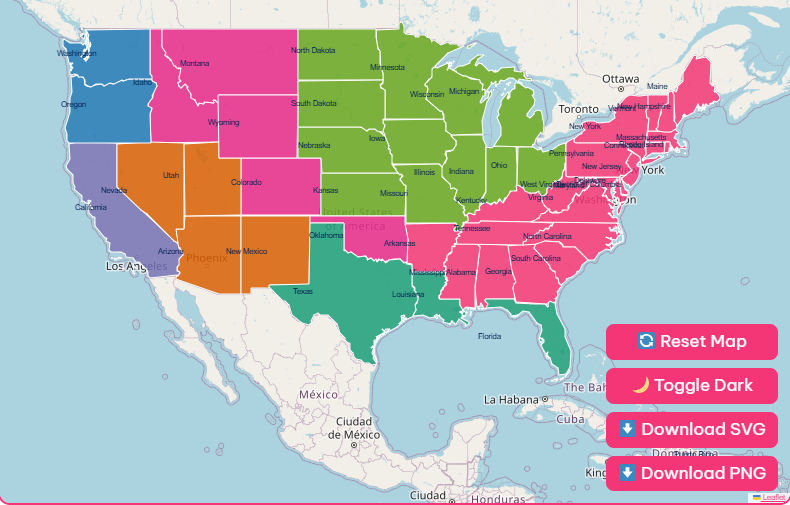
Tip: Click a state to open details, zoom in/out to explore, and download the map in PNG or blank printable SVG format.
From the arid deserts of the Southwest to the tropical shores of Florida and the icy tundra of Alaska, the United States is home to an incredible diversity of climates.
Understanding this variety is crucial for everything from agriculture and urban planning to predicting the weather.
Climate maps serve as essential tools for visualizing and analyzing these complex patterns, offering a detailed picture of the country’s climatic landscape.
Understanding US Climate Zones
To make sense of the vast climatic differences across the United States, scientists use classification systems to group areas with similar weather patterns.
The most widely recognized system is the Köppen-Geiger climate classification.
The Köppen-Geiger Climate Classification System
Developed by German-Russian climatologist Wladimir Köppen in the late 19th and early 20th centuries, this system is the most widely used for classifying climates.
It divides climates into five main groups, which are further broken down into subcategories. Each climate type is represented by a 2 to 4 letter code.
The classification is based on empirical data, primarily annual and monthly averages of temperature and precipitation.
The system links climate types to the native vegetation of a region, making it an intuitive tool for understanding the relationship between climate and ecosystems.
The five main groups in the Köppen-Geiger system are:
| Group | Name | Description |
| A | Tropical | All months have an average temperature of 18°C (64.4°F) or higher. |
| B | Arid (Dry) | Little precipitation throughout the year. |
| C | Temperate | Mild winters; at least one month averages above 10°C (50°F). |
| D | Continental | Cold winters with at least one month averaging below 0°C (32°F). |
| E | Polar | Extremely cold winters and summers. All months average below 10°C (50°F). |
Regional Climate Variations Across the USA
East of the 100th Meridian
Humid Continental (Dfa, Dfb)
This climate dominates the northern regions, including the Northern Plains, Midwest, Great Lakes, and New England.
It is characterized by four distinct seasons with warm to hot summers and cold, snowy winters. Cities like Chicago, Minneapolis, and Boston fall into this zone.
Humid Subtropical (Cfa)
Found in the Southeastern states, this zone experiences hot, humid summers and mild winters.
This climate extends from the coast of Virginia down to central Florida and west to parts of Texas and Oklahoma. Atlanta, Houston, and New Orleans are prime examples.
West of the 100th Meridian
Semi-Arid and Desert (BSk, BWh, BWk)
Much of the interior West, including the Great Basin and the Southwest, is characterized by dry climates.
This ranges from cold semi-arid in states like Idaho and the Dakotas to hot deserts in Arizona, Nevada, and Southern California. Phoenix and Las Vegas experience extreme summer heat in this zone.
Mediterranean (Csa, Csb)
The coast of California enjoys a Mediterranean climate, known for its warm, dry summers and mild, wet winters.
This climate is ideal for agriculture, particularly wine and fruit production. Los Angeles and San Francisco are located in this zone.
Alpine (ET)
The high-elevation areas of major mountain ranges like the Rocky Mountains, Sierra Nevada, and Cascades have an alpine climate.
These regions experience cold, harsh conditions year-round due to their altitude.
The Growing Impact of Climate Change
Specific Regional Impacts
California and the West
Prolonged droughts and record-breaking heatwaves have dramatically increased the risk of wildfires.
Dwindling snowpack in the Sierra Nevada mountains threatens the water supply for millions of people.
Florida and the Gulf Coast
Rising sea levels pose a severe threat to coastal communities. Nuisance flooding during high tides is becoming more common, and infrastructure is increasingly at risk.
The Southeast
This region is experiencing more intense and frequent hurricanes.
Warmer ocean waters provide more energy for storms, leading to stronger winds and heavier rainfall, as seen in recent devastating hurricane seasons.
The Midwest
Shifts in temperature and precipitation are affecting the “Corn Belt.” While longer growing seasons may seem beneficial,
extreme heat and unpredictable rainfall can damage crops and disrupt agricultural economies.
Alaska
As the fastest warming state, Alaska is facing profound changes. Melting permafrost is damaging roads, buildings, and pipelines.
The retreat of sea ice also impacts indigenous communities that rely on it for hunting and travel.
The Data Behind the Maps
Creating an accurate US climate map requires collecting and processing massive amounts of data.
Here’s a look at what goes into these powerful visualizations:
Data Types
The primary data points are temperature (minimum, maximum, and average) and precipitation (rain and snowfall). Data is collected daily from thousands of weather stations.
Data Sources
Government agencies like NOAA’s National Centers for Environmental Information (NCEI) are the main sources.
They manage historical and real-time data from weather stations, satellites, and radar systems.
Spatial Resolution
This refers to the level of detail on a map. Modern climate maps, like those from the CEC, can have a spatial resolution as fine as 1 kilometer, allowing for highly localized climate analysis.
Data Visualization
This data is then processed and displayed in various formats, including static maps, interactive online atlases, and downloadable shapefiles for use in GIS software.
Advancing Your Climate Knowledge
We encourage you to use the resources mentioned in this guide to dive deeper.
Explore the interactive maps, download the datasets, and see for yourself how the climate varies across the country and how it is changing.
The more we understand our climate, the better prepared we will be to face the challenges of the future.
Frequently Asked Questions
How is a climate map different from a weather map?
A weather map shows atmospheric conditions at a specific point in time (e.g., today’s forecast). A climate map, on the other hand, shows long term averages of weather patterns over decades, providing a picture of a region’s typical climate.
Where can I find historical climate data for my city?
NOAA’s NCEI website is the best resource for historical climate data. You can access monthly and daily records for thousands of locations across the United States.
What does the “1991-2020 Normals” mean?
The 1991-2020 period is the most recent 30-year average used by meteorologists and climatologists as a baseline for comparing current weather and climate.