Tip: click any state to open its page, zoom in/out, and download the map in blank printable SVG or PNG.
Have you ever checked the weather, only to find yourself confused by a swirl of colors, lines, and strange symbols? You’re not alone.
Weather maps are powerful tools for understanding everything from a gentle spring shower to a major hurricane, but they can seem complex.
Learning to read them unlocks a deeper understanding of the world around you, helping you plan your day, stay safe during severe weather, and even appreciate the intricate patterns of our atmosphere.
Understanding Weather Map Basics
Before diving into different maps, it’s essential to grasp the fundamental elements that appear on them.
These symbols and lines are the language of meteorology, telling the story of the atmosphere.
Pressure Systems: Highs and Lows
Weather maps are dominated by high and low-pressure systems, which drive most weather phenomena.
High-Pressure System (H)
Indicated by a blue ‘H’. High pressure is associated with sinking air, which suppresses cloud formation.
This typically brings calm, clear skies and fair weather.
Low-Pressure System (L)
Marked with a red ‘L’. Low pressure involves rising air, which cools and condenses to form clouds and precipitation.
These systems are responsible for storms, rain, and wind.
Weather Fronts
A front is the boundary between two different air masses. The movement and interaction of these fronts create weather changes.
| Front Type | Symbol | Associated Weather |
| Cold Front | A blue line with blue triangles | Rapid temperature drops, heavy rain, thunderstorms. |
| Warm Front | A red line with red semi-circles | Gradual temperature increase, steady light rain or drizzle. |
| Stationary Front | Alternating blue triangles and red semi-circles | A standoff between air masses, often causing prolonged cloudiness and precipitation. |
| Occluded Front | A purple line with alternating triangles and semi-circles | Forms when a cold front overtakes a warm front, bringing complex weather patterns. |
Other Common Symbols
Isobars
These are lines connecting points of equal atmospheric pressure. Closely packed isobars indicate a steep pressure gradient and strong winds.
Wind Barbs
These symbols show both wind direction and speed. The “feathers” on the barb denote speed, while the line points in the direction the wind is coming from.
Troughs and Ridges
These are elongated areas of low and high pressure, respectively. Troughs often bring unsettled weather, while ridges bring stability.
8 Essential Types of USA Weather Maps
To get a complete picture of the weather, meteorologists use several different types of maps. Each one provides a unique piece of the puzzle.
| Map type | What it shows | Best for |
| Temperature | Hot/cold zones | Travel and daily planning |
| precipitation | Rain/ snow expectation | Storm preparation |
| Radar | Live storms | Real time tracking |
| Snowfall | Expected snow | Winter travel |
| Wind speed | Wind gusts | Aviation and boating |
| Severe weather | Risk zones | Safety |
| Humidity | Moisture levels | Comfort analysis |
| Heat index | Feels like temperature | Outdoor work safety |
1. Surface Analysis Maps
A surface analysis map is a snapshot of the weather conditions at ground level.
It combines pressure systems, fronts, isobars, and station data (temperature, dew point, wind) to provide a comprehensive overview.
2. Temperature Maps
These maps are straightforward, using a color gradient to show temperature variations across the country.
A typical temperature map might illustrate a heatwave in the Southwest, with deep reds and purples covering Arizona, Nevada,
and Southern California, while cooler blues and greens dominate the Northeast. You can see at a glance where the hot and cold spots are.
3. Precipitation Maps
Precipitation maps show where rain, snow, or ice is expected to fall and in what amount.
Colors often indicate the intensity, with greens and blues for light precipitation and yellows and reds for heavier downpours.
4. Radar Maps
Radar maps are essential for tracking real-time precipitation. Radar works by sending out radio waves that bounce off raindrops, snowflakes, and hail.
The returned signal reveals the location, intensity, and movement of precipitation.
5. Wind Speed Maps
These maps use colors or wind barbs to display wind velocity and direction.
They are crucial for identifying areas with strong gusts, which can be associated with severe storm systems.
6. Humidity and Heat Index Maps
Humidity maps show the amount of moisture in the air.
This information is often combined with temperature to create a Heat Index map, which indicates the “feels like” temperature.
7. Snowfall Maps
Specifically focused on winter weather, snowfall maps forecast the amount of snow expected to accumulate over a certain period.
8. Severe Weather Maps
Issued by agencies like the Storm Prediction Center, these maps outline areas at risk for severe weather, including tornadoes, large hail, and damaging winds.
A Tour of USA Weather Zones
The United States is a vast country with incredibly diverse climates. Understanding these major weather zones helps put local forecasts into a broader context.
Pacific Coast (Washington, Oregon, California)
This region is known for its mild but wet winters and dry, warm summers.
The Pacific Ocean has a moderating effect, keeping temperatures from reaching extreme highs or lows.
The presence of the Cascade and Sierra Nevada mountain ranges creates a “rain shadow,” where the western slopes receive abundant moisture while the eastern sides remain dry.
Mountain West (Idaho, Montana, Wyoming, Nevada, Utah, Colorado, Arizona, New Mexico)
Characterized by high altitudes and rugged terrain, this zone sees dramatic weather shifts.
Winters bring heavy snowfall, especially at higher elevations, which is crucial for the region’s water supply. Summers can be hot and dry, leading to a risk of wildfires.
The Plains (North Dakota, South Dakota, Nebraska, Kansas, Oklahoma, Texas)
This region experiences some of the most extreme temperature fluctuations in the country. It’s a battleground for cold, dry air from the north and warm, moist air from the Gulf of Mexico.
This clash of air masses makes the southern Plains the heart of “Tornado Alley,” where conditions are often ripe for severe thunderstorms and tornado outbreaks in the spring.
Midwest (Ohio, Michigan, Indiana, Illinois, Wisconsin, Minnesota, Iowa, Missouri)
The Midwest experiences four distinct seasons. Its weather is influenced by its central location, far from the moderating effects of oceans.
A significant phenomenon here is “lake-effect snow,” where cold air passing over the relatively warm waters of the Great Lakes picks up moisture and dumps,
heavy snow on the downwind shores, particularly in states like Michigan and New York.
Southeast (Arkansas, Louisiana, Mississippi, Alabama, Georgia, Florida, Tennessee, North Carolina, South Carolina)
This zone has a humid subtropical climate, with hot, muggy summers and mild winters.
Its proximity to the Gulf of Mexico and the Atlantic Ocean makes it highly susceptible to hurricanes from June through November.
These powerful storms can bring devastating winds, storm surges, and flooding to the entire coastline.
Northeast (Maine, New Hampshire, Vermont, Massachusetts, Rhode Island, Connecticut, New York, Pennsylvania, New Jersey, Delaware, Maryland)
Like the Midwest, the Northeast experiences four distinct seasons, but its weather is also heavily influenced by the Atlantic Ocean.
This can lead to powerful coastal storms known as “Nor’easters,” which can bring blizzard conditions, heavy snow, and coastal flooding.
Desert Southwest ( Arizona, Nevada, New Mexico, Utah)
Hot, dry climate with minimal rainfall and extreme summer heat.
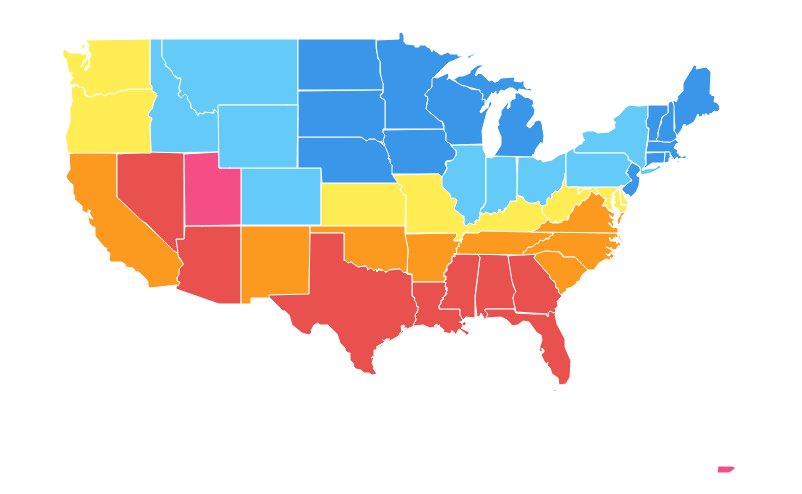
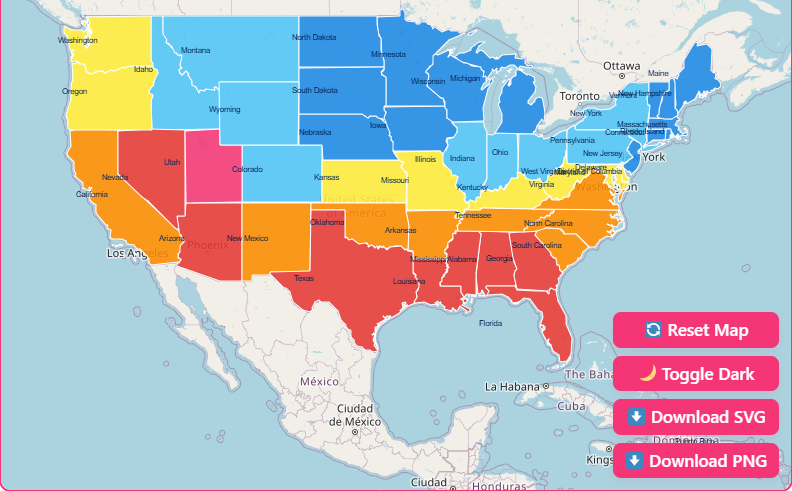
Accessing and Using Our Free Weather Map
Here’s what makes our map a superior choice for weather enthusiasts and travelers:
State Based Weather Zones
Instead of a generic national view, you can focus on state-specific weather, giving you targeted and relevant information.
Interactive Zoom and Pan
Dive deep into local conditions. Our smooth zoom and pan functionality lets you explore weather patterns from a national scale down to your own neighborhood.
Color Coded Weather Regions
Intuitive color schemes make it easy to interpret complex data at a glance, whether you’re looking at temperature, precipitation, or wind speed.
Dark Mode Toggle
View the map comfortably in any lighting condition. Switch to dark mode for a less strenuous viewing experience at night or in low-light environments.
SVG/PNG Download
Need a map for a presentation, report, or personal project? You can easily download high-quality images of the current map view.
Your Next Step: Become a Weather Watcher
We encourage you to explore our interactive map, apply what you’ve learned, and share your weather insights with friends and family.
The more you practice, the more confident you’ll become in interpreting the complex, beautiful dance of the atmosphere.
Frequently Asked Questions
What’s the difference between a weather watch and a weather warning?
A “watch” means that conditions are favorable for severe weather to develop.
A “warning” means that severe weather is occurring or is imminent, and you should take immediate action to protect yourself.
What are El Niño and La Niña?
These are climate patterns in the Pacific Ocean that can significantly affect weather worldwide.
El Niño (a warming of the ocean surface) often brings wetter conditions to the southern US and warmer weather to the north.
La Niña (a cooling of the ocean surface) typically results in drier conditions in the south and colder weather in the north.
Why does a “rain shadow” occur?
A rain shadow happens when a mountain range forces moist air to rise and cool, causing it to release its moisture as precipitation on the windward side.
By the time the air descends on the other side (the leeward side), it is dry, creating an arid or semi-arid region. The Great Basin in the western US is a prime example.
How are tornadoes formed?
Tornadoes typically form from severe thunderstorms, known as supercells.
They require a specific combination of ingredients: warm, moist air near the ground, cool, dry air aloft,
and wind shear (changing wind speed and direction with height), which creates the rotation.