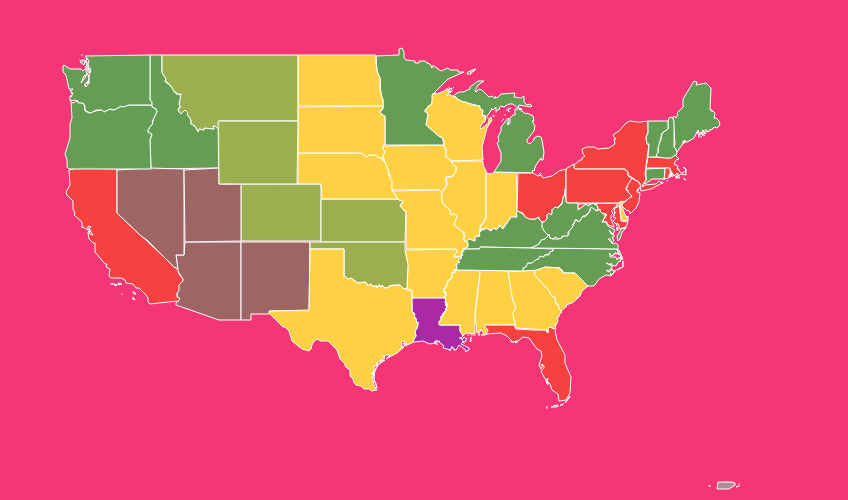
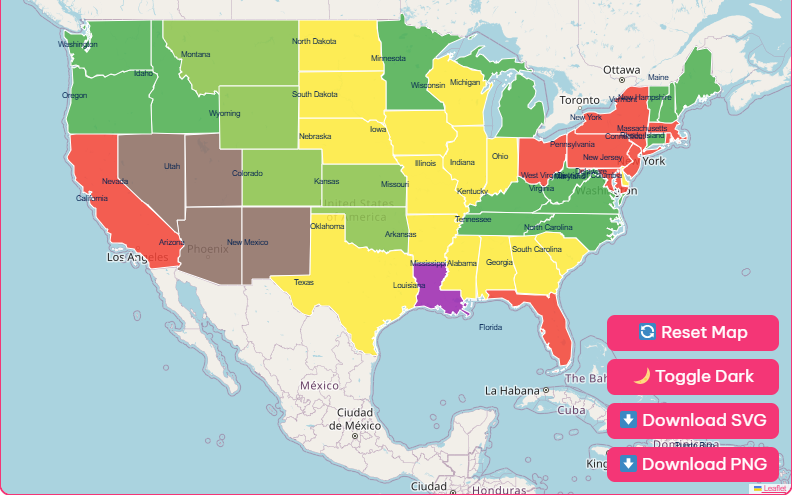
Tip: Click on any state to explore, zoom in and zoom out, and download free in PNG and blank printable SVG.
The United States covers nearly 3.8 million square miles, a vast expanse of forests, farms, cities, and wildlands.
How this land is used shapes the nation’s economy, environment, and the daily lives of its citizens.
A United States land use map offers a powerful visual tool for understanding the intricate patterns of how we live, work, and grow.
An Overview of US Land Categories
Land in the United States is broadly divided into several major categories.
While different agencies may use slightly different classifications, the general breakdown offers a clear snapshot of the nation’s geography.
| Land Use Category | Percentage of Lower 48 States | Area (Square Miles) |
| Forests | 27% | 842,400 |
| Shrubland | 24% | 748,800 |
| Agriculture/Cropland | 17% | 530,400 |
| Grassland & Pasture | 17% | 530,400 |
| Wetlands | 5% | 156,000 |
| Urban Areas | 2% | 63,400 |
| Other | 5% | 156,000 |
| Open Space | 3% | 93,600 |
Data based on 2017 figures for the lower 48 states.
Forests
Covering over a quarter of the country, forests are vital for biodiversity, timber production, and carbon storage.
These areas range from the temperate rainforests of the Pacific Northwest to the hardwood forests of the Appalachian Mountains.
Shrubland
Often found in arid and semi-arid regions of the West, shrubland is characterized by low-lying woody plants.
It provides critical habitat for many species and is an important part of the ecological balance in these dry landscapes.
Agriculture
Cropland is the backbone of the nation’s food supply, with the Midwest’s “Corn Belt” being one of the most productive agricultural regions in the world.
In 2017, agriculture and related industries contributed over $1 trillion to the U.S. GDP.
Grasslands and Pasture
These areas are essential for livestock grazing and ranching.
The Great Plains, stretching from Montana to Texas, is a prime example of this land use, supporting a significant portion of the country’s cattle industry.
Wetlands
Wetlands, including swamps, marshes, and bogs, are incredibly diverse ecosystems.
They play a crucial role in filtering water, controlling floods, and providing habitats for countless species of plants and animals.
Urban Areas
Though they cover only about 2-3% of the land, urban areas are home to over 82% of the U.S. population.
These densely populated hubs are the centers of commerce, culture, and innovation, but they also present unique challenges for sustainable development.
Mapping the Nation: The National Land Cover Database (NLCD)
To understand these patterns in detail, researchers and planners rely on sophisticated mapping tools.
The National Land Cover Database (NLCD) is the definitive source for land cover data in the United States.
Managed by the U.S. Geological Survey (USGS) in partnership with the Multi-Resolution Land Characteristics (MRLC) Consortium, the NLCD provides highly detailed maps at a 30-meter resolution.
Since 2001, the NLCD has been updated periodically, creating a rich historical record of how the American landscape has changed. Key products from the NLCD include:
Land Cover Maps
These classify land into 16 different types, such as deciduous forest, cultivated crops, and various levels of developed areas.
Urban Imperviousness
This dataset shows the percentage of surfaces, like roads and buildings, that don’t absorb water. It is a key indicator of urbanization.
Tree Canopy Cover
This product maps the percentage of land covered by tree crowns, helping to monitor forest health and urban green space.
Charting a Better Future
Understanding the United States land use map is more than an academic exercise. It is essential for tackling some of the most pressing issues of our time.
From the housing crisis in our cities to the preservation of our natural resources, how we manage our land has profound consequences.